
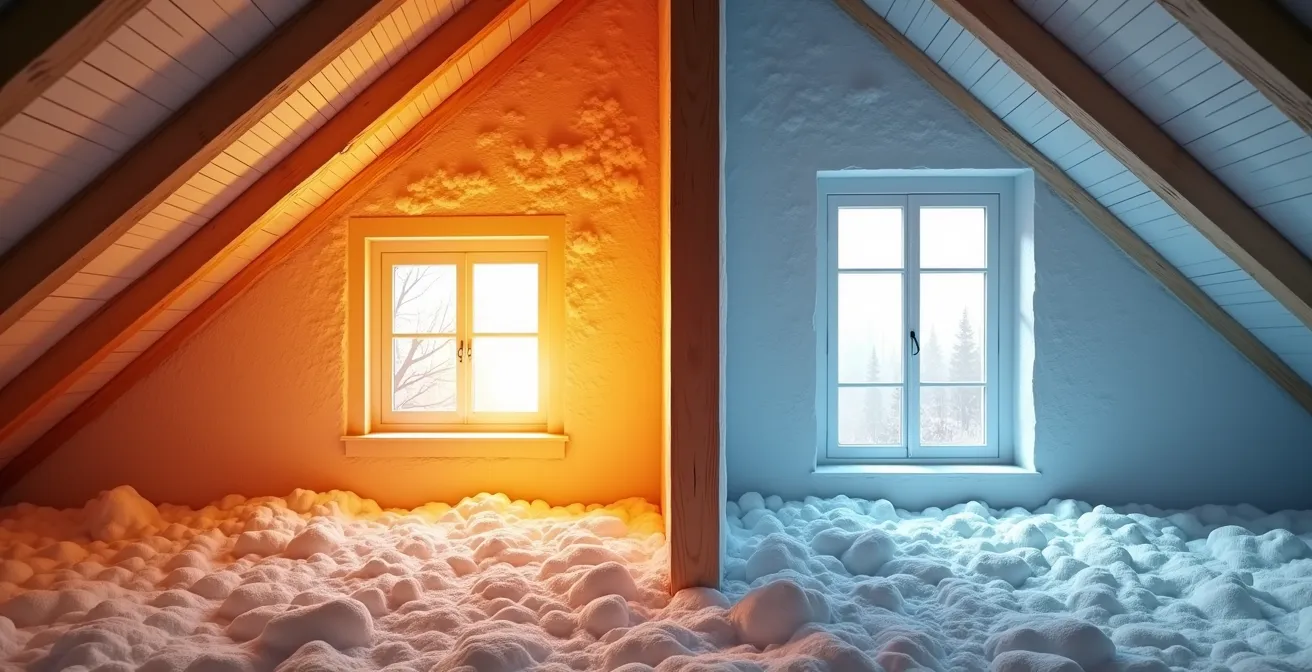
Your high energy bill isn’t caused by drafts; it’s the result of silent ‘heat highways’ in your home’s structure called thermal bridges, which conventional methods fail to detect.
- Thermal bridges, not just air leaks, can be responsible for up to a third of your home’s total heat loss.
- Simple tools like an incense stick and a cheap infrared thermometer can reveal these hidden problems more effectively than just feeling for drafts.
Recommendation: Shift your focus from sealing visible gaps to diagnosing and neutralizing these structural weak points to achieve significant savings and comfort.
That persistent chill you feel, even with the windows sealed tight and the heating on full blast, isn’t just in your imagination. It’s a tangible symptom of a hidden problem that costs homeowners hundreds, if not thousands, of dollars every year. Many people instinctively blame drafts, spending weekends caulking windows and weather-stripping doors. While these are not wasted efforts, they often target the wrong enemy. This approach is like treating the symptom—the feeling of cold air—without diagnosing the underlying disease.
The real culprit is often a far more insidious and invisible issue: the thermal bridge. These are structural “heat highways” built directly into your home—areas where materials like concrete slabs, steel beams, or window frames conduct heat directly from the inside to the outside. They are silent, they don’t produce a noticeable breeze, and they can be responsible for a staggering amount of energy loss. According to extensive research, these weak points can account for up to one third of a building’s transmission heat loss. This means a significant portion of the money you spend on heating is literally passing through your walls.
But if these bridges are invisible, how can you possibly find them without hiring a professional with an expensive thermal camera? This is where the diagnostic mindset of an energy auditor comes in. The key is not to just look for cold spots, but to understand the evidence your house is giving you. This guide will walk you through a professional, low-cost diagnostic process. We will explore how to interpret the subtle clues your home provides, differentiate between a simple air leak and a critical thermal bridge, and prioritize repairs that will actually make a dent in your energy bills.
This article provides a complete roadmap for becoming your own home’s energy detective. You will learn to perform simple yet powerful tests, understand the science behind heat loss, and make informed decisions that will improve your comfort and your finances. Let’s delve into the methods that separate amateur draft-hunting from professional-grade diagnostics.
Summary: How to Uncover Your Home’s Hidden Energy Leaks
- Why Does Your House Feel Drafty Even With the Windows Closed?
- How to Perform a Blower Door Test Alternative With Incense?
- Smart Thermostat or Habits: Which Saves More on Heating Bills?
- The Ventilation Mistake That Causes Mold in Energy-Efficient Homes
- When to Upgrade Windows: Before or After Insulating the Attic?
- How to Calculate Your True Carbon Footprint Without Generic Estimators?
- How to Use a Watt-Meter to Catch Energy-Hogging Old Appliances?
- Which Insulation Material Best Prevents Summer Overheating?
Why Does Your House Feel Drafty Even With the Windows Closed?
The feeling of a draft is a primal signal to our brains that heat is being lost. However, the assumption that this feeling is always caused by moving air is a critical diagnostic error. While air leakage from poorly sealed windows or doors is a real issue, the persistent, room-wide chill you’re experiencing is often due to a different phenomenon: convective currents created by thermal bridges. A thermal bridge is a pathway of high thermal conductivity in your building’s envelope, like a metal stud inside a wall or the concrete edge of a floor slab. These materials act as “heat highways,” efficiently pulling warmth out of your living space.
Here’s what happens: the interior surface of the wall over a thermal bridge becomes significantly colder than the rest of the wall. The warm air inside your room comes into contact with this cold surface, cools down, becomes denser, and sinks. This sinking cold air displaces the warmer air at floor level, pushing it upwards. This creates a slow, continuous, and silent loop of moving air—a convective current. You perceive this as a “draft,” but no outside air is actually entering the room at that spot. You are feeling your own, self-generated indoor weather system, powered by the heat escaping through your walls.
This distinction is vital. Sealing a nearby window will do nothing to stop a convective current caused by a thermal bridge. You can spend an entire weekend with a caulk gun and still feel that same chill because you’ve misdiagnosed the problem. The first step in an energy auditor’s diagnostic mindset is to question the evidence. Instead of asking “Where is the draft coming from?”, ask “Is this moving air an air leak, or is it a convection current telling me where a thermal bridge is located?”
How to Perform a Blower Door Test Alternative With Incense?
Professionals use a blower door test to depressurize a house and find air leaks, but you can replicate the core principle for almost no cost. This simple yet powerful technique allows you to not only find leaks but, more importantly, to differentiate them from the convection currents caused by thermal bridges. The key is to create negative pressure in your home. Close all windows and exterior doors. Then, turn on all your exhaust fans—the kitchen hood, all bathroom fans, and the clothes dryer (on an air-only setting). This action pulls air out of the house, forcing outside air to sneak in through any available crack or gap.
Now, it’s time to deploy your diagnostic tool: an incense stick. Light the incense and let it produce a steady trail of smoke. The way this smoke behaves is your evidence. As explained by energy consultant Frans Dam, you must learn to read the smoke’s pattern. Slowly move the lit incense stick along the edges of windows, doors, electrical outlets on exterior walls, and where walls meet the floor or ceiling.

Observe the smoke closely. If the smoke trail is pulled sharply and horizontally towards a specific point, you have found an air leak. The negative pressure is sucking outside air in through that gap. However, if you are near a wall surface (not a seam) and the smoke slowly tumbles or rolls downwards, you are witnessing a convection current. This is the tell-tale sign of a thermal bridge. The air is not coming from outside; it’s the indoor air cooling against the cold spot on the wall and sinking. You can confirm this by using a cheap infrared thermometer (around $20) to check the surface temperature. A significant cold spot combined with a downward-rolling smoke pattern is a confirmed thermal bridge.
Case Study: Differentiating Leaks from Bridges
Energy consultant Frans Dam demonstrates this method to great effect. In his diagnostics, he first uses an infrared thermometer to identify cold spots on walls and ceilings. Then, he uses the incense stick to determine the nature of the problem. A sharp, horizontal pull confirms an air leak that needs sealing. A gentle, downward-rolling smoke pattern over the cold spot confirms a thermal bridge, indicating a need for insulation or a thermal break, a completely different and more significant repair.
Smart Thermostat or Habits: Which Saves More on Heating Bills?
In the quest to lower heating bills, homeowners often turn to two popular solutions: technology, in the form of a smart thermostat, or behavior, by adopting habits like wearing sweaters and lowering the temperature at night. Both strategies have merit and can yield savings. A smart thermostat automates setbacks and learns your schedule, while conscious habits reduce overall heat demand. However, both of these approaches are fundamentally limited because they act as high-tech or low-tech bandages over a potentially gaping wound: unaddressed thermal bridges.
A smart thermostat may lower the temperature when you’re away, but it can’t stop the constant, rapid heat loss through a concrete balcony slab connected directly to your living room floor. Likewise, wearing a sweater only makes you more tolerant of the cold; it does nothing to prevent the money you’re spending on heat from escaping through structural weak points. The reality is, fixing the root cause of heat loss provides a far greater return on investment than simply managing the symptoms. Addressing thermal bridges directly reduces the baseline amount of energy your home needs to stay warm, making any subsequent adjustments with a thermostat or habits far more effective.
The following table puts the potential impact of these different approaches into perspective. It highlights that while smart devices and habits contribute, they pale in comparison to the savings achieved by tackling the structural integrity of your home’s thermal envelope.
| Approach | Potential Savings | Initial Cost | Effectiveness with Thermal Bridges |
|---|---|---|---|
| Smart Thermostat Only | 10-15% | $200-300 | Limited – masks underlying issues |
| Habit Changes Only | 5-10% | $0 | Moderate – reduces heat demand |
| Fixing Thermal Bridges | Up to 30% | $500-2000 | High – addresses root cause |
| Combined Approach | 35-45% | $700-2300 | Maximum – comprehensive solution |
Before investing in expensive solutions, it’s crucial to quantify your problem. A “Thermal Recovery Rate Test” is a simple diagnostic you can perform to gauge the severity of your home’s heat loss.
Action Plan: Your Thermal Recovery Rate Test
- Record the current room temperature and the exact time of day.
- Set your thermostat 5°C (or 9°F) lower than its current setting and leave it for exactly one hour.
- After one hour, return the thermostat to its original, comfortable temperature and start a timer.
- Monitor how long it takes for the room to return to the original temperature you recorded in step 1.
- If the recovery period takes more than two hours, it’s a strong indicator that your home has a significant heat loss problem, likely involving major thermal bridges.
The Ventilation Mistake That Causes Mold in Energy-Efficient Homes
As homes become more airtight to save energy, a dangerous paradox can emerge. In the process of sealing air leaks, we can inadvertently trap moisture inside. When this trapped, humid air encounters a cold surface created by a thermal bridge, it leads to condensation, and subsequently, mold. This isn’t just a cosmetic issue; it’s a serious health hazard. The critical factor here is the dew point—the temperature at which air becomes saturated with moisture and water vapor turns into liquid.
The mistake is thinking that ventilation is only about bringing in “fresh air.” Strategic ventilation is about moisture *removal*. In a well-sealed home, everyday activities like cooking, showering, and even breathing release significant amounts of moisture into the air. If this moisture isn’t actively exhausted to the outside, the relative humidity inside the house rises dramatically. When this warm, moist air comes into contact with a window frame, a concrete corner, or a steel beam that is acting as a thermal bridge, the surface temperature of that spot can easily drop below the dew point.
This triggers condensation, creating the damp environment where mold thrives. You might see it as black spots in the corner of a room or as moisture on the inside of your windows. This is a direct signal of a thermal bridge at work. The solution isn’t to stop sealing air leaks; it’s to pair airtightness with controlled, mechanical ventilation that targets moisture at its source (e.g., high-quality exhaust fans in kitchens and bathrooms).
Case Study: The Science of Dew Point Condensation
A technical analysis demonstrates this process perfectly. In a home with an ambient temperature of a comfortable 19.9°C but a high relative humidity of 70%, the dew point is reached at 14.2°C. Thermodetectors used in the study identified thermal bridges where the wall surface temperature dropped below this critical 14.2°C threshold. In these specific zones, condensation formed, creating the ideal breeding ground for mold, even while the rest of the wall remained perfectly dry.
When to Upgrade Windows: Before or After Insulating the Attic?
Homeowners facing high energy bills often grapple with a major financial decision: should the budget go towards new, high-performance windows or towards beefing up attic insulation? The marketing for new windows is compelling, promising draft-free comfort and modern aesthetics. However, from a pure building science and financial perspective, the answer is almost always unequivocal: insulate the attic first. This decision is rooted in the fundamental physics of heat flow.
Heat rises. In the winter, the vast, uninterrupted surface of your ceiling is one of the largest areas of potential heat loss. If your attic is poorly insulated, the warm air you’ve paid to heat your home will pass straight through your ceiling and escape into the cold attic space, and then to the outdoors. Even old, single-pane windows represent a smaller total surface area than your entire ceiling. While they are certainly a source of heat loss, their overall impact is often dwarfed by an under-insulated attic. Research from authoritative bodies like the BRE Group confirms thermal bridging can be responsible for up to 30% of a dwelling’s heat loss, and the junction between the wall and an uninsulated roof is a massive thermal bridge.
Upgrading your attic insulation is typically less expensive, less disruptive, and provides a much faster and greater return on investment than a full window replacement. Prioritizing the attic addresses the single biggest source of heat loss first. Once the attic is properly insulated, the relative impact of the windows becomes more significant, and at that point, upgrading them becomes a much more logical and financially sound next step. Fixing the attic first reduces the overall workload on your heating system, immediately lowering your bills and making your entire home more comfortable.
How to Calculate Your True Carbon Footprint Without Generic Estimators?
Online carbon footprint calculators are a popular starting point, but they are fundamentally flawed. They rely on broad averages for location, home size, and utility usage, completely ignoring the single biggest variable: the actual thermal performance of your specific building. Two houses of the same size in the same zip code can have wildly different carbon footprints if one is riddled with thermal bridges and the other is well-insulated. To understand your true impact, you must move from generic estimation to a “bottom-up” calculation based on your home’s diagnosed heat loss.
A true calculation starts with the energy that is being wasted. While the precise physics formula (Q = U × A × ΔT) is best left to professionals, the concept is simple: measure the energy escaping through weak points and convert that waste into carbon emissions. Every hour your heating system runs to compensate for heat escaping through a thermal bridge, it generates CO2. This wasted energy accumulates, creating a “carbon debt” that grows every year the problem goes unfixed. This is a much more powerful and accurate metric than a generic estimate.
The global impact of this issue is staggering. Poorly performing buildings are a primary driver of climate change. In fact, according to Nature Scientific Data, building operations account for 30% of global final energy consumption and 27% of total energy sector emissions. By diagnosing and fixing the thermal bridges in your own home, you are not just saving money; you are taking a direct and measurable action to reduce your personal contribution to this global problem. Your true footprint isn’t an abstract average; it’s the sum of the energy your home actually consumes and wastes.
How to Use a Watt-Meter to Catch Energy-Hogging Old Appliances?
A watt-meter is an excellent tool for hunting down “energy vampires”—devices that draw power even when turned off. Many homeowners are shocked to find their entertainment centers or kitchen gadgets are costing them money 24/7. However, this focus on standby power often distracts from a much larger, albeit indirect, energy hog: the cost of compensating for a cold house. The biggest energy-hogging appliance in a home with thermal bridges is often the portable electric heater you use to make a chilly room bearable.
Instead of just measuring the standby power of your TV, use the watt-meter as a diagnostic tool. Plug a space heater into the meter and place it in that perpetually cold room. Run it until the room feels comfortable, then check the meter to see how many kilowatt-hours (kWh) it consumed. This gives you a direct, tangible measurement of the energy (and money) you are spending specifically to fight the effects of thermal bridges in that one room. Often, the cost of running a single space heater for a month will far exceed the annual cost of every “vampire” device in your house combined.
This exercise reframes the problem. The issue isn’t a $2/month phantom load from your coffee maker; it’s a $40/month comfort cost directly attributable to poor insulation and thermal bridging. This watt-meter test provides the financial motivation to invest in a permanent fix rather than continuing to pay for an expensive, temporary solution.
This table illustrates the dramatic difference in scale between common “energy vampires” and the hidden costs associated with thermal bridges.
| Energy Loss Type | Monthly Cost | Annual Impact | Priority Level |
|---|---|---|---|
| Standby Power (All Devices) | $1-3 | $12-36 | Low |
| Single Major Thermal Bridge | $30-50 | $360-600 | High |
| Comfort Appliances (compensating) | $15-25 | $180-300 | Medium |
| Refrigerator Against Cold Wall | $5-10 extra | $60-120 extra | Medium |
Case Study: Targeted Measures Yield Big Savings
An energy efficiency company in the UK used thermography to identify severe thermal bridging and a “reverse chimney effect” in an old Victorian house. Homeowners were using portable heaters in several rooms to stay comfortable. After implementing targeted insulation measures based on the diagnostic findings, the homeowners were able to stop using the supplemental heaters and reduced their overall heating costs by 20%—a saving far greater than what could be achieved by unplugging chargers.
Key Takeaways
- Your home’s persistent chill is likely caused by silent convective currents from thermal bridges, not just drafts.
- A simple incense stick can help you differentiate between an air leak (horizontal smoke) and a thermal bridge (downward-rolling smoke).
- Fixing structural thermal bridges yields far greater savings (up to 30%) than relying on smart thermostats or behavioral changes alone (10-15%).
Which Insulation Material Best Prevents Summer Overheating?
When choosing insulation, most people focus on a single metric: the R-value. This number measures a material’s resistance to heat flow, and a higher R-value means better performance in the winter. However, this only tells half the story. In an era of hotter summers, preventing overheating is just as important as staying warm in winter. For summer comfort, a different metric is far more critical: phase shift or thermal mass. Phase shift measures how many hours it takes for heat from the sun to travel through the insulation and enter your living space.
Materials like fiberglass and foam board have high R-values but very low thermal mass. They resist heat flow, but they don’t delay it. On a hot summer day, the heat quickly passes through them, and your house starts to heat up by early afternoon, forcing your air conditioning to work overtime. In contrast, materials with a high phase shift, like dense-pack cellulose or wood fiber, act like a thermal sponge. They absorb the sun’s heat during the day and release it very slowly. An insulation with a 10-12 hour phase shift can absorb the peak afternoon heat and not release it into your home until late at night, when you can simply open the windows to cool the house down naturally.
Choosing the right material is about balancing winter performance (R-value) with summer comfort (phase shift). For a truly resilient and energy-efficient home, prioritizing materials that excel in both categories is the smartest long-term investment. As the following table shows, some of the most effective materials for summer are not necessarily the ones with the highest R-value per inch.
| Material | R-Value (per inch) | Phase Shift (hours) | Cost (per sq ft) | Summer Performance |
|---|---|---|---|---|
| Fiberglass | 3.2 | 1-2 | $0.50 | Poor |
| Foam Board | 5.0 | 2-3 | $1.00 | Fair |
| Rock Wool | 3.3 | 3-4 | $0.75 | Good |
| Cellulose | 3.5 | 7-9 | $0.60 | Very Good |
| Wood Fiber | 3.4 | 10-12 | $1.50 | Excellent |
Thermal bridges can cause the loss of up to 30% of the heat generated by one’s heating system.
– METRA Building Engineering Team, METRA Building Technical Guide
By adopting this diagnostic mindset, you transform from a passive bill-payer into an active manager of your home’s performance. You can now make targeted, cost-effective improvements that solve the root cause of your discomfort and high energy costs, leading to a home that is not only cheaper to run but healthier and more comfortable to live in, year-round. Begin your investigation today by performing the simple incense test to uncover the first clues.